Companies on Five or More AI Infrastructure Providers Lose More Time. A Vendor Survey Cannot Say Why
Nscale's survey of 500 US AI-native businesses links five or more infrastructure providers to more lost engineering time. The same data shows size and regulation pushing firms towards more providers, so it cannot show which drives which.
Nscale, an AI infrastructure provider, reported on 28 October 2026 that 73 per cent of AI-native businesses using five or more infrastructure providers lose more than a quarter of their engineering time to infrastructure work. Among those using one or two providers, the figure was 40 per cent. The numbers come from a July 2026 survey of 500 US AI-native businesses that Nscale ran and published in its State of AI Natives 2026 report.
The gap is large, and Nscale presents it as the cost of fragmentation. It deserves a closer look for a different reason. The survey records how many providers a company uses and how much engineering time it loses, and the two rise together. It does not show which one drives the other, and the same report supplies evidence that company size and regulation push firms towards more providers regardless.
A fast-growing sector reports strained infrastructure
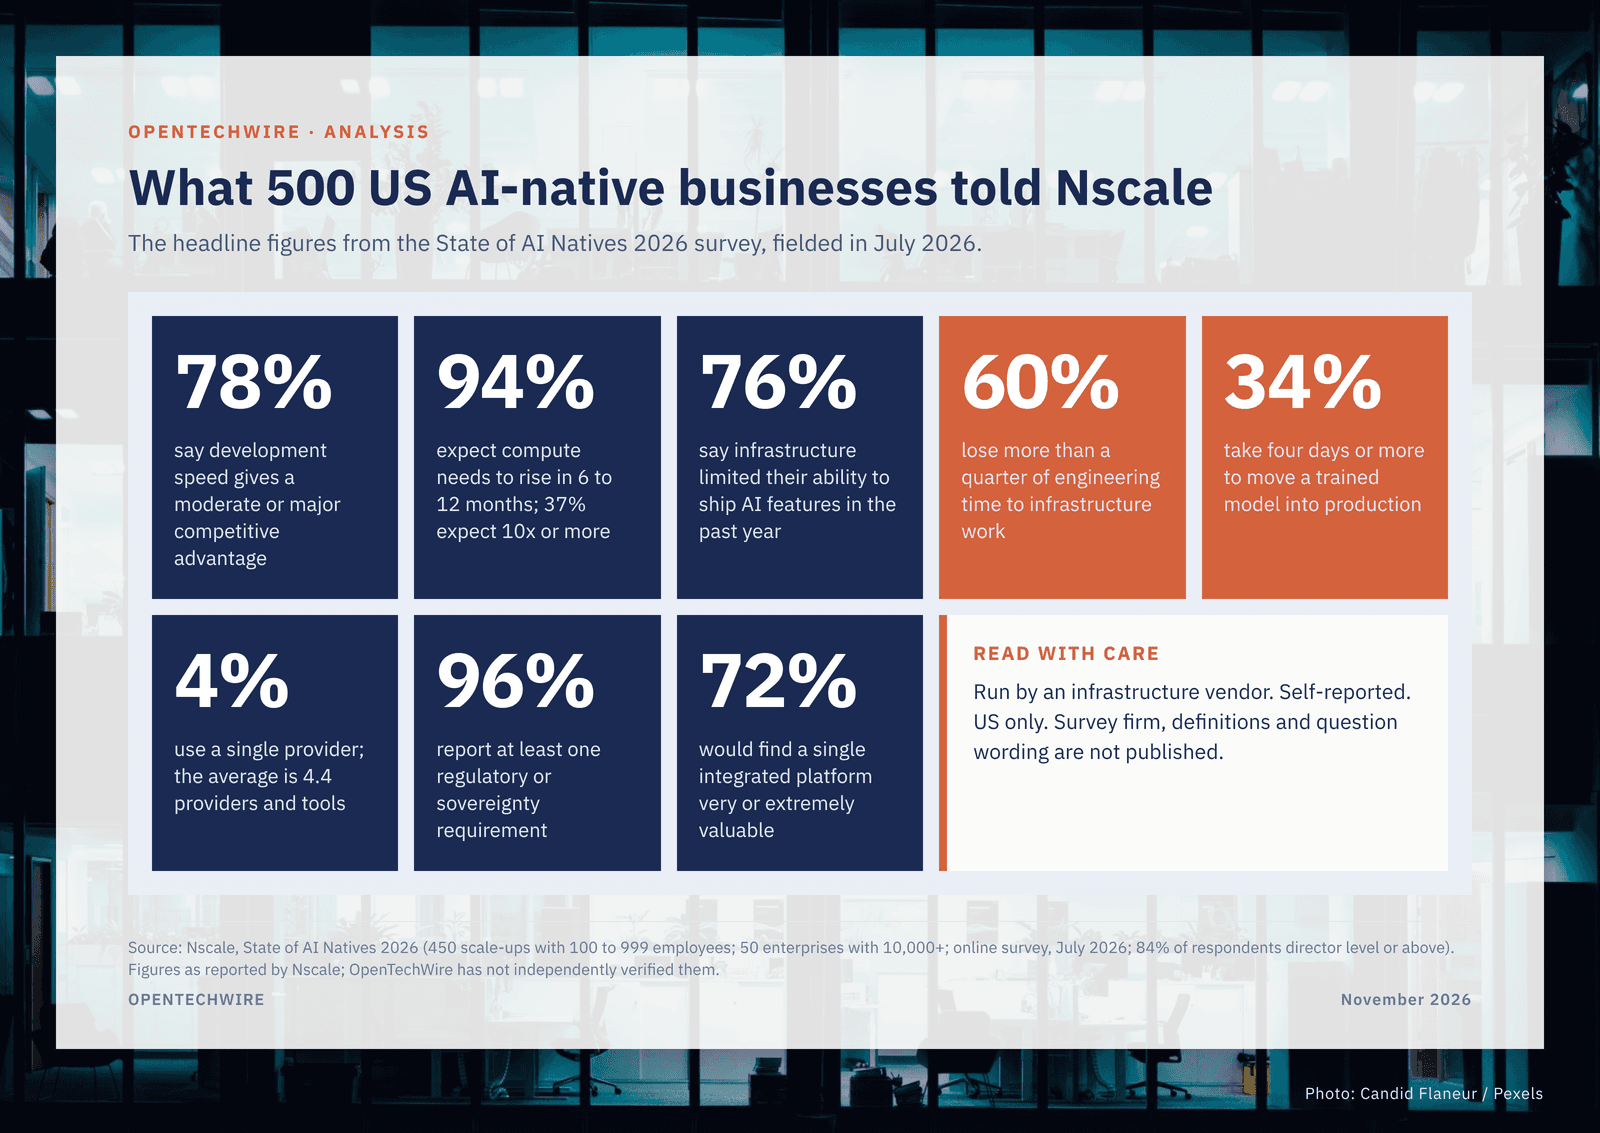
The survey covers 450 scale-ups with 100 to 999 employees and 50 enterprises with 10,000 or more, across software, fintech, cybersecurity, healthcare and other sectors. Seventy-eight per cent said development speed gives them a moderate or major competitive advantage, rising to 90 per cent among the 50 large enterprises, a small base.

Demand is expected to grow. Ninety-four per cent expect their compute needs to rise over the next 6 to 12 months and 37 per cent expect a rise of 10 times or more. Those are forecasts from respondents. Gartner's spending estimates point the same way. In a press release dated 10 August 2026, the research firm forecast worldwide AI-optimised infrastructure-as-a-service (IaaS) spending of US$42 billion in 2026, up 96 per cent from about US$21.5 billion in 2025, and US$66 billion in 2027.

Infrastructure is already a constraint, according to the respondents. Seventy-six per cent said it limited their ability to ship AI features in the past year, and for 27 per cent it is a frequent bottleneck. Sixty per cent said they lose more than 25 per cent of engineering time to infrastructure work, including 11 per cent who lose more than half. Thirty-four per cent said moving a trained model into production takes four days or more. All of these are respondents' own estimates.


Provider count tracks the penalty, and the report's own figures hint at why
Only 4 per cent of respondents rely on a single infrastructure provider. The average company uses 4.4 providers and tools across the AI lifecycle, and the large enterprises average 5.4. Nscale says the pattern is often deliberate: 54 per cent use several providers for capability coverage and 42 per cent for commercial leverage.
The cost shows up in two measures. Companies using five or more providers were nearly twice as likely as those using one or two to lose more than a quarter of engineering time (73 per cent against 40 per cent, with 53 per cent at three to four providers). Forty-four per cent of the five-plus group take four days or more to move a model into production, against 17 per cent of the one-to-two group, a gap of more than two and a half times.

Two things in the same report complicate a causal reading. Provider count rises with company size, since the large enterprises carry the highest average. And 96 per cent of respondents reported at least one regulatory or sovereignty requirement: 41 per cent handle regulated or sensitive data, 37 per cent must keep workloads on specific infrastructure, 31 per cent are bound by data-residency laws and 29 per cent operate across several jurisdictions. A company bound by residency rules in two regions may need a provider in each, whatever its engineering preferences.

Sovereignty requirements keep adding providers
Independent forecasts show sovereignty pressure growing outside the United States. Gartner said on 9 February 2026 that worldwide sovereign cloud IaaS spending would total US$80.4 billion in 2026, up 35.6 per cent from US$59.3 billion in 2025, and reach US$110.6 billion in 2027. Its table has Europe rising from US$6.9 billion in 2025 to US$12.6 billion in 2026, an increase of 83 per cent, and to US$23.1 billion in 2027, which would put it ahead of North America's US$21.1 billion.
Asia-Pacific starts from a smaller base. Gartner's table puts mature Asia-Pacific sovereign cloud IaaS spending at US$1.6 billion in 2026, up 87 per cent from US$851 million. The Nscale sample is American, and this research found no comparable survey of AI-native businesses in Asia's markets, so the provider-count figures cannot be assumed to carry across.

The capacity side is also moving in Asia's markets. The e-Conomy SEA 2025 report from Google, Temasek and Bain & Company, released on 11 November 2025, counts more than 680 AI start-ups in Southeast Asia that drew over US$2.3 billion in the preceding 12 months. It says more than 4,600 MW of planned capacity would raise regional data-centre capacity by 180 per cent, against 120 per cent for the rest of Asia-Pacific, based on announcements as of the first half of 2025. The World Economic Forum's ASEAN Digital Economy Outlook 2026, published on 14 September 2026 from evidence on more than 4,500 businesses, points to continuing friction in cross-border trade, payments and data transfer. None of these sources measures provider count or engineering time.
Flexera's 2026 State of the Cloud report, released on 18 March 2026 from a survey of more than 750 cloud decision-makers and users, found that 85 per cent name managing cloud spend as a top challenge. It also reported that 29 per cent of respondents saw increased wasted cloud spend, the first rise in five years, which Flexera links to growing cloud-based AI workloads. Flexera sells cloud cost-management software and has its own interest in the framing.
The survey cannot separate cause from circumstance
The 40, 53 and 73 per cent gradient is a cross-tabulation of two self-reported answers, and it is consistent with at least three readings. Providers could cause the overhead, which is Nscale's reading. Company size and regulatory burden could drive both provider count and lost time. Or strained teams could add providers to gain capacity or leverage, in which case the lost time comes first. The report does not say whether the comparison was adjusted for size, workload mix or regulatory exposure, and it does not publish the cut that would test it.

Other gaps matter. Neither the report nor the Nscale pages reviewed for this article name a survey firm or publish fieldwork method, screening criteria, a definition of "AI-native" or the wording of the questions. The provider count covers "providers and tools", and Nscale's blog post of 28 October describes the average as 4 where the report says 4.4.
The most commercially relevant finding comes from a hypothetical question. Seventy-two per cent said a single platform combining compute, storage, networking and AI tools would be very or extremely valuable, rising to 84 per cent among businesses outside the Series A to D venture track. That measures expected value and says nothing about experience of such a platform. Nscale sells an integrated AI infrastructure platform and says so in the report. In May 2026 Nscale secured US$790 million in debt financing for its Narvik site in Norway, where Microsoft rents Nvidia capacity, according to Data Center Dynamics and tech.eu. None of that makes the survey wrong. It does mean the claim that buyers want consolidation comes from a seller of consolidation.

Why that may not matter much
The causal gap weakens the sales case for consolidation. It leaves three findings standing.
- The size of the gap is hard to wave away. Provider count moves two outcome measures together, lost engineering time and time to production, by 33 points (73 per cent against 40) and 27 points (44 per cent against 17). Confounding could account for some of that spread, and the survey gives no way to measure how much.
- Independent sources describe the same strain. Flexera's respondents name spend management as a top challenge, and Gartner's forecasts show AI-optimised IaaS spending roughly doubling in 2026. Those sources do not measure engineering time, so they corroborate the pressure and leave the provider-count question open.
- Sovereignty is an external constraint. Whichever way causation runs, 96 per cent of respondents face a regulatory or sovereignty requirement, and Gartner expects sovereign cloud IaaS spending to keep rising. Any consolidation would have to fit inside those requirements, and Nscale's report says its platform is built to retain sovereignty controls.
The real test is a like-for-like comparison: companies of the same size, workload mix and regulatory exposure, grouped by provider count, with lost engineering time measured from time-tracking records instead of recollection. Nobody has published that yet. Nor has anyone answered whether an integrated platform reduces lost time. The survey asks what respondents would value. It does not follow customers of integrated platforms, and this research found no independent dataset that does.
Asia's market is moving from adoption to execution
The question the survey keeps returning to, what a technology choice changes in practice, is also the one Asia's markets are putting to AI. IDC said on 17 September 2026 that AI and generative AI spending in Asia-Pacific, including China and Japan, would reach US$555.2 billion by 2030, up from US$121.5 billion in 2025. The region spans markets as different as Singapore, Japan, Indonesia and Vietnam, each with its own languages, regulations and infrastructure.
That is the setting in which Asia Awards Organization (AAO) is introducing the Asia Tech Awards (ATA), in partnership with Asia Press Centre Group, which publishes OpenTechWire. ATA adds technology and digital innovation as the third pillar of AAO's regional programmes, alongside the Asia Architecture Design Awards (AADA) and the Asia Hospitality Awards (AHA). The inaugural programme has 24 categories covering technology, digital innovation, companies, products and people.

Technology already runs through AAO's sectors, from smart-building systems in architecture to AI and automation in hospitality. AAO says its existing programmes have recorded more than 1,500 nominations, 250 winners, participation from 15 countries and 20 international jurors across four seasons of AADA and two of AHA. ATA's first season belongs to AAO's 2027 cycle under the theme "Visionary Asia", and the three programmes are expected to converge at AAO's Winners' Night in Bangkok in May 2027.

What to watch
The survey establishes that provider count and lost engineering time rise together among US AI natives. It does not establish that adding or removing providers changes the loss. Three checkable items will show how far the picture firms up:
- Whether Nscale publishes lost engineering time by provider count within company size and regulatory exposure, or names its survey firm and question wording. The State of AI Natives 2026 page on nscale.com is the place to check.
- Gartner's next sovereign cloud IaaS update against its published path of US$80.4 billion in 2026 and US$110.6 billion in 2027, including whether Europe's US$23.1 billion passes North America's US$21.1 billion.
- Any survey of AI-native companies in Asia's markets that asks the same provider-count and engineering-time questions.
Sources: Nscale (State of AI Natives 2026 report and blog post of 28 October 2026), Gartner (press releases of 9 February and 10 August 2026), Flexera (press release of 18 March 2026), Google, Temasek and Bain & Company (e-Conomy SEA 2025, 11 November 2025), IDC (17 September 2026), the World Economic Forum (14 September 2026), tech.eu (11 May 2026) and Data Center Dynamics. ATA details are from AAO and the earlier OpenTechWire article on the programme. Survey figures are as reported by their publishers and have not been independently verified by OpenTechWire.
Credit: Charts and infographics by OpenTechWire from the figures cited. Gartner and Nscale data credited in each caption.